
Frequency Analyzer
Energy per frequency band, averaged across the whole track — not a single instantaneous snapshot — so you can see the actual balance behind what you're hearing and identify tonal emphasis.
- 01
Upload Track
Upload a WAV, MP3, FLAC or AIFF file for analysis. See our privacy notice for file handling.
- 02
Analyze Spectrum
Energy is averaged per band across the whole track using Welch's method.
- 03
Read The Balance
See which bands carry the most energy and identify tonal emphasis.
DROP YOUR TRACK
or click to choose a file
WAV, MP3, AIFF, or FLAC · Limits are checked before processing. Nothing is used for model training — see our privacy notice.
- Uploading
- Analyzing
- Ready
Analyzing — running the same measurement pass as Track Analyzer…
Frequency Balance
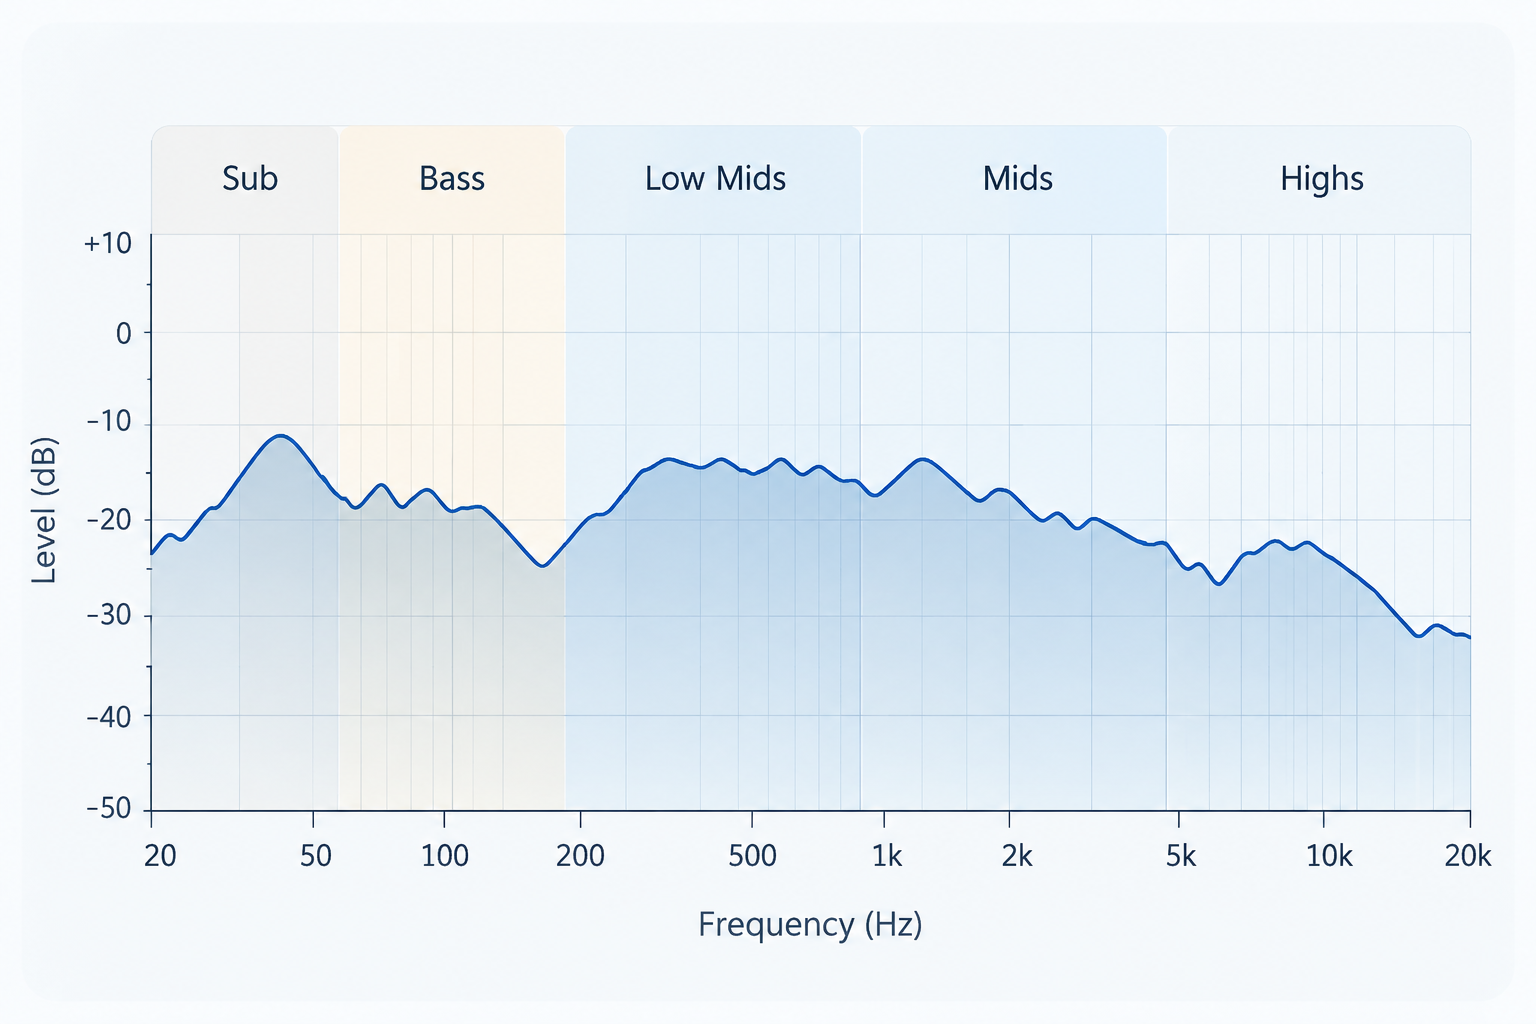
Each band shows its share of the total measured energy from 20 Hz to 20 kHz. Wider bands cover more frequencies; there is no universal ideal percentage.
Average frequency spectrum
Reanalyze your track to generate its spectrum.
How to read the spectrum
Time-averaged FFT power across both channels. Frequency runs logarithmically from 20 Hz to 20 kHz; 0 dB is this curve’s highest point, not absolute loudness. Bass, midrange and high-frequency peaks show tonal balance. This does not diagnose masking between instruments or guarantee mix quality.
Waveform
Drawn locally in your browser from the file you selected — not sent anywhere to render this.
What this is: Frequency Analyzer reads the exact same measurement Track Analyzer already computes on your file in one pass — this page just gives that one result its own focused view. Want the full picture (loudness, dynamics, mix health, frequency balance, and more, all at once)? Open Track Analyzer →
Want mix health, loudness, and stereo width too?
Track Analyzer runs the full measurement pass — one free upload, every result at once.
Open Track Analyzer